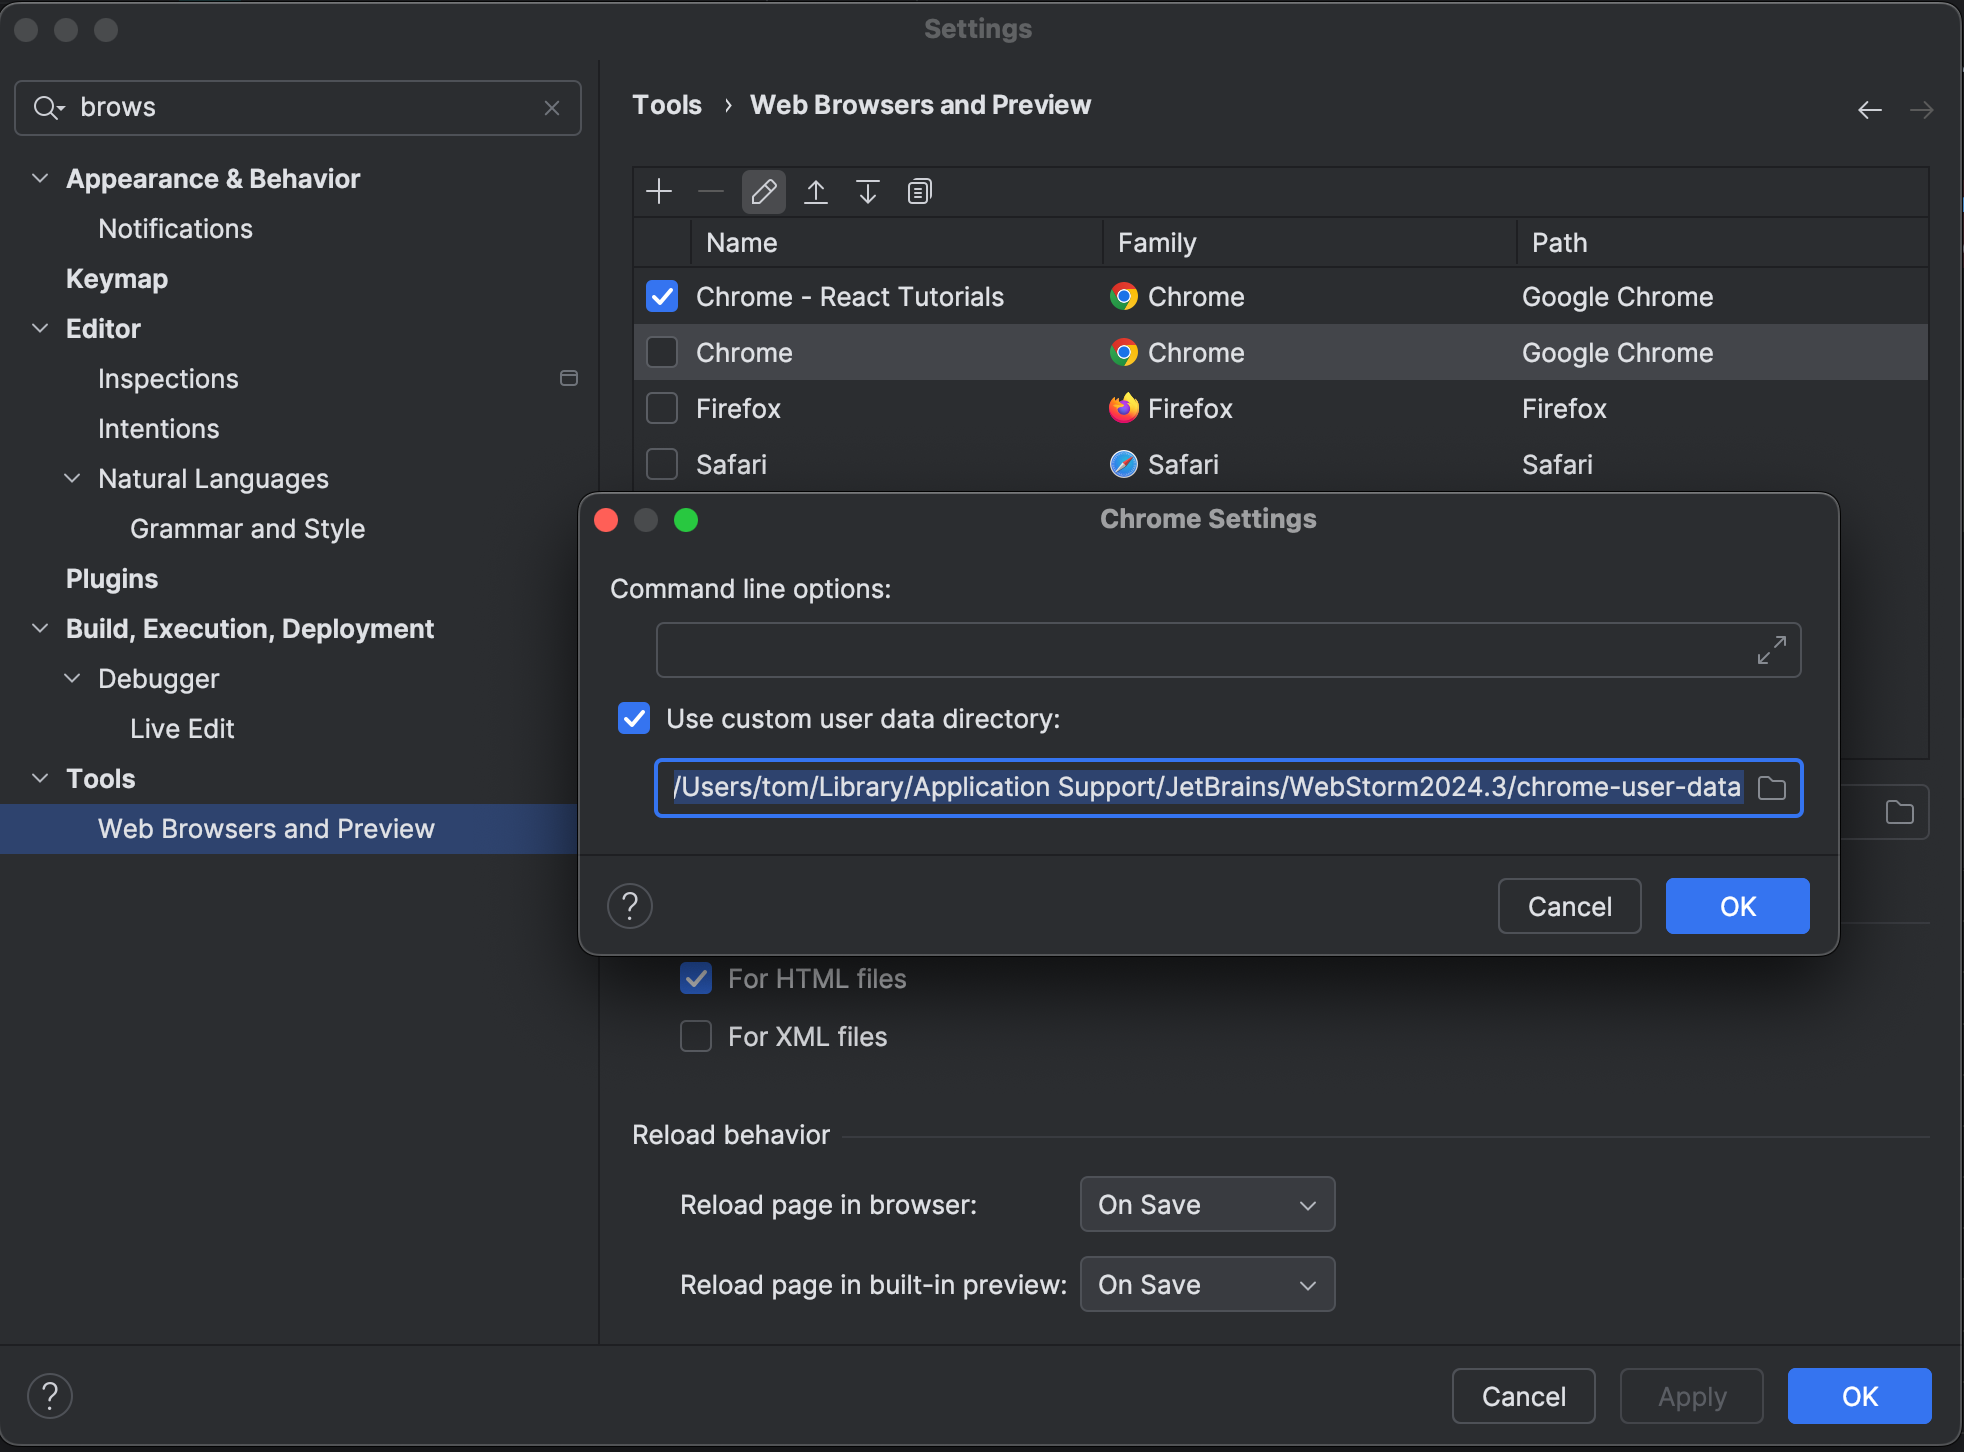
If Chrome is already running with that User Data Directory, it can’t be launched with a debugging port. That’s why WebStorm uses a custom one, by default, ~/Library/Application Support/JetBrains/WebStorm2024.3/chrome-user-data or similar. That way it can launch browsers from its own user data dir without impacting whatever version of chrome you were using. It’s also why none of your profiles show up.
Unless you hate yourself, it’s probably easiest to just configure the first profile that pops up and leave it at that. If you edit Chrome (⌘-, → Web Browsers and Preview), you can put in some other directory and it will populate it for you.
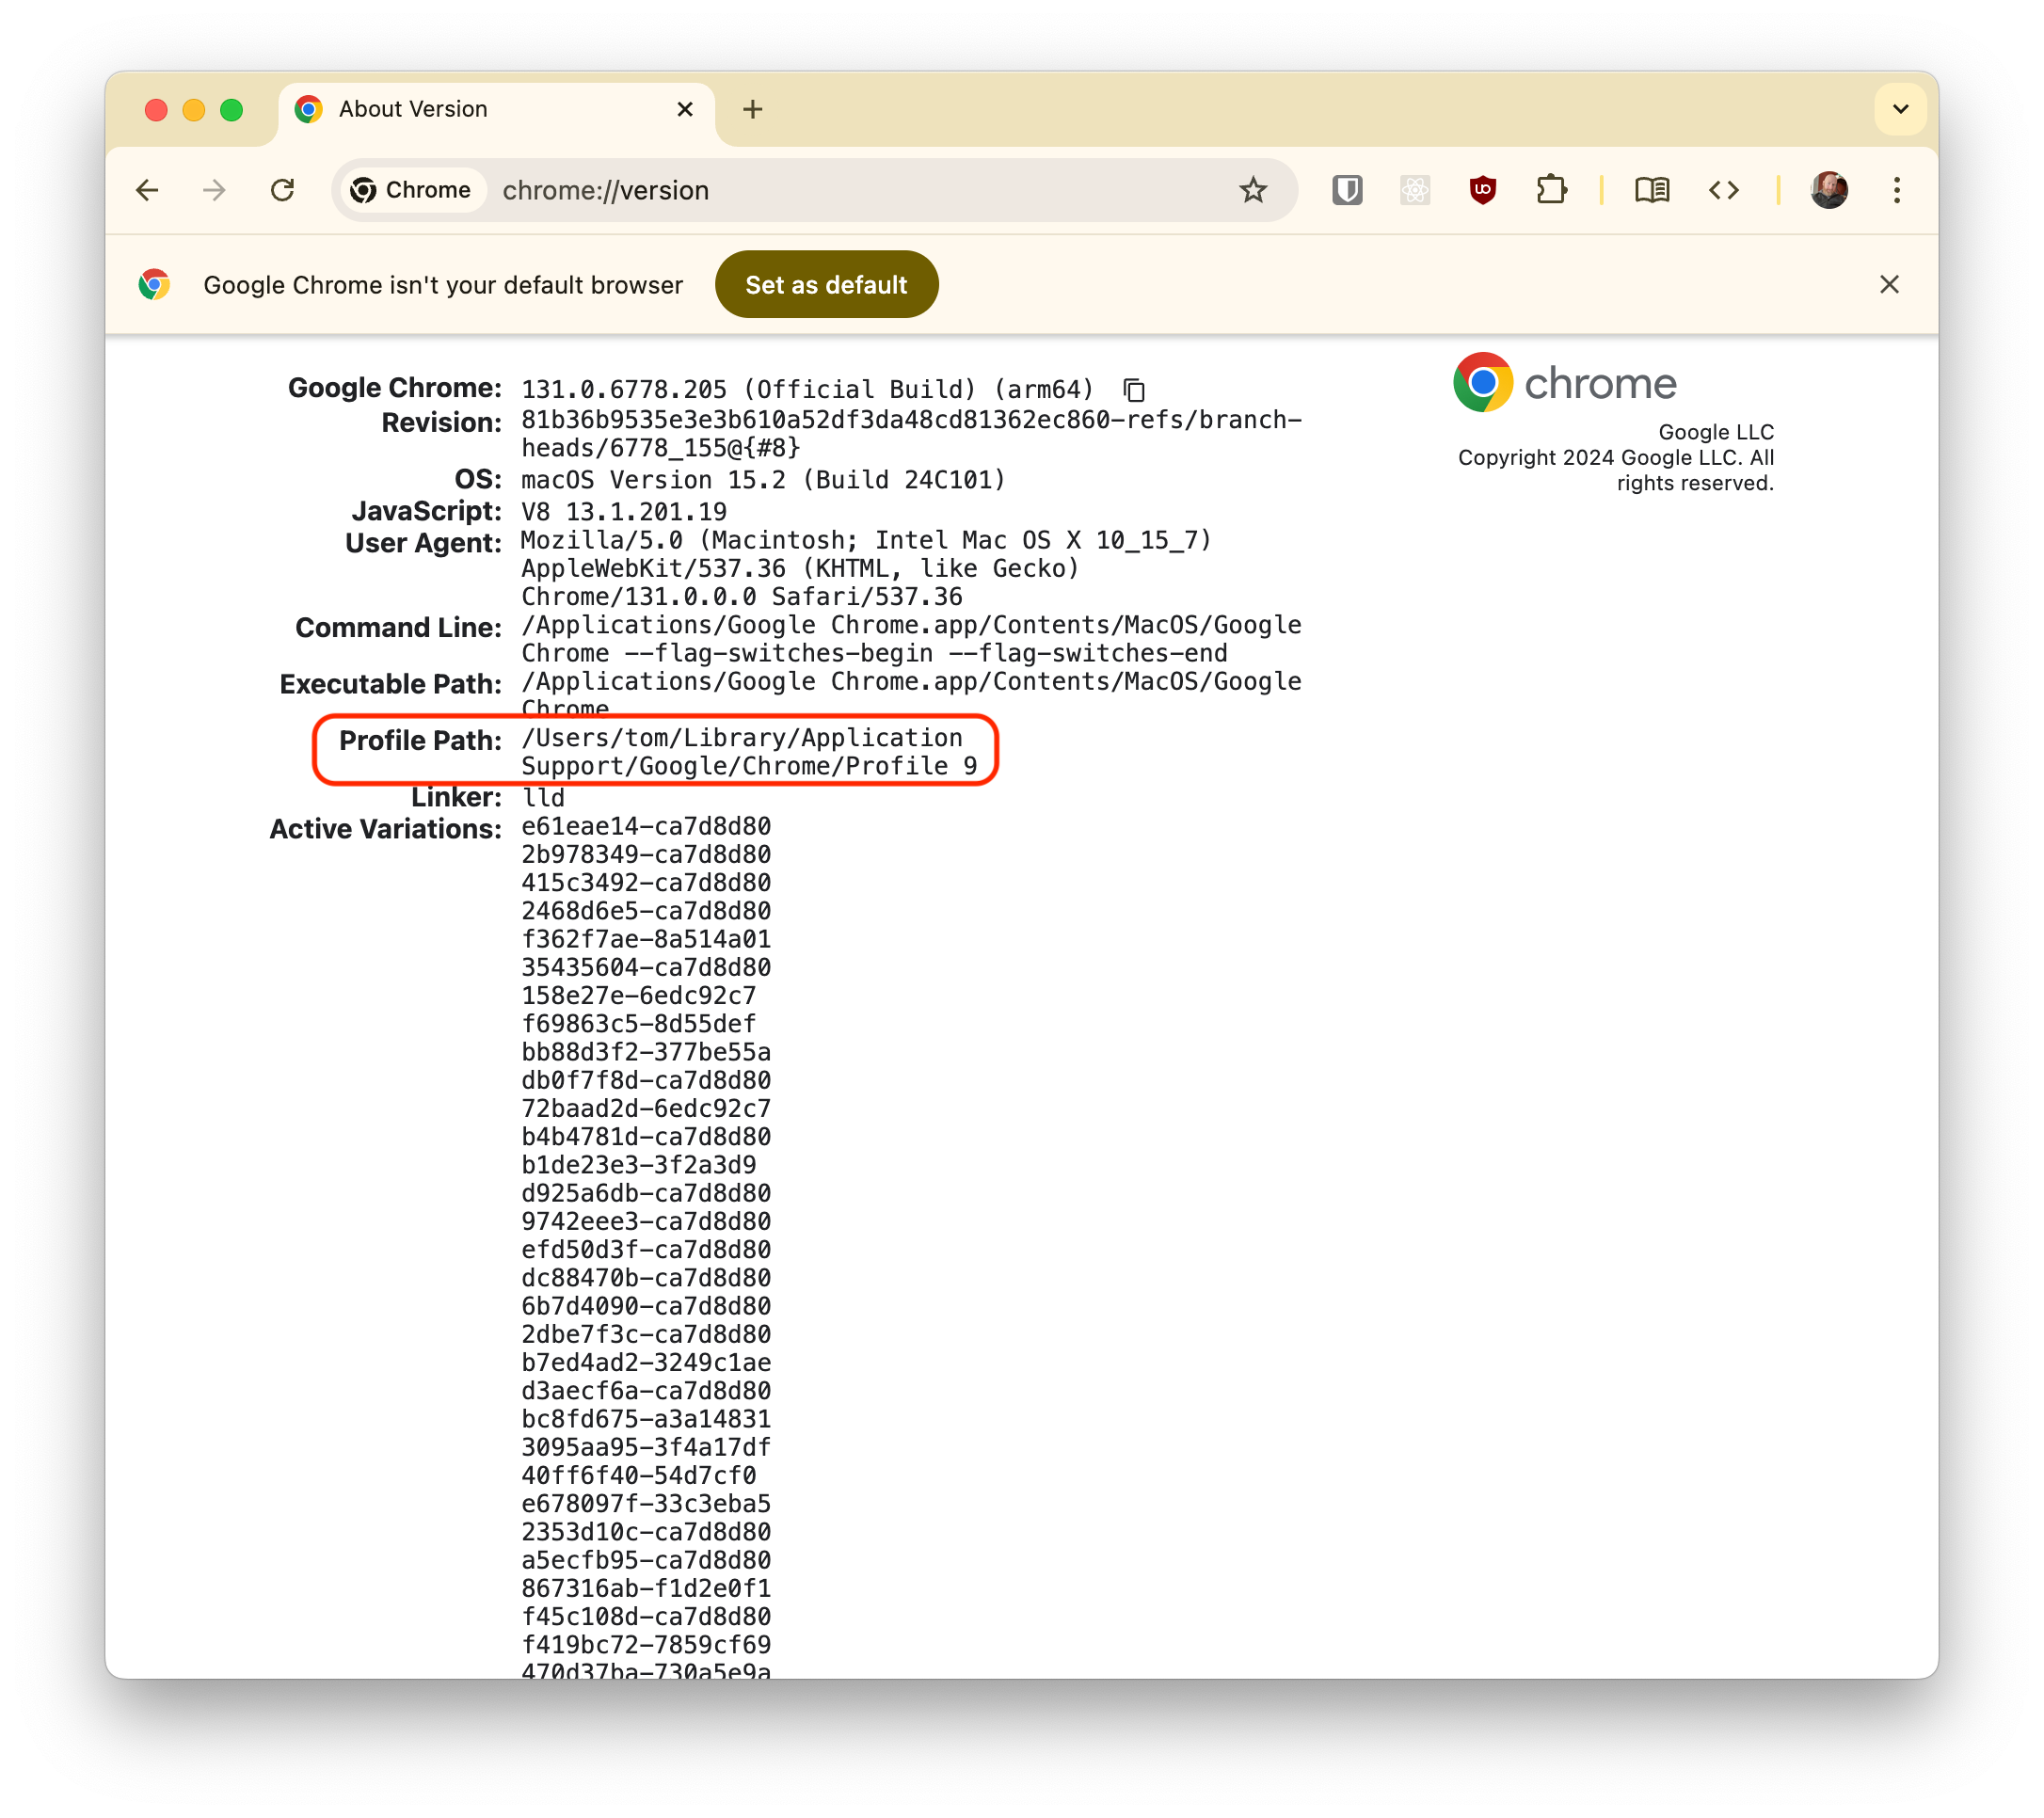
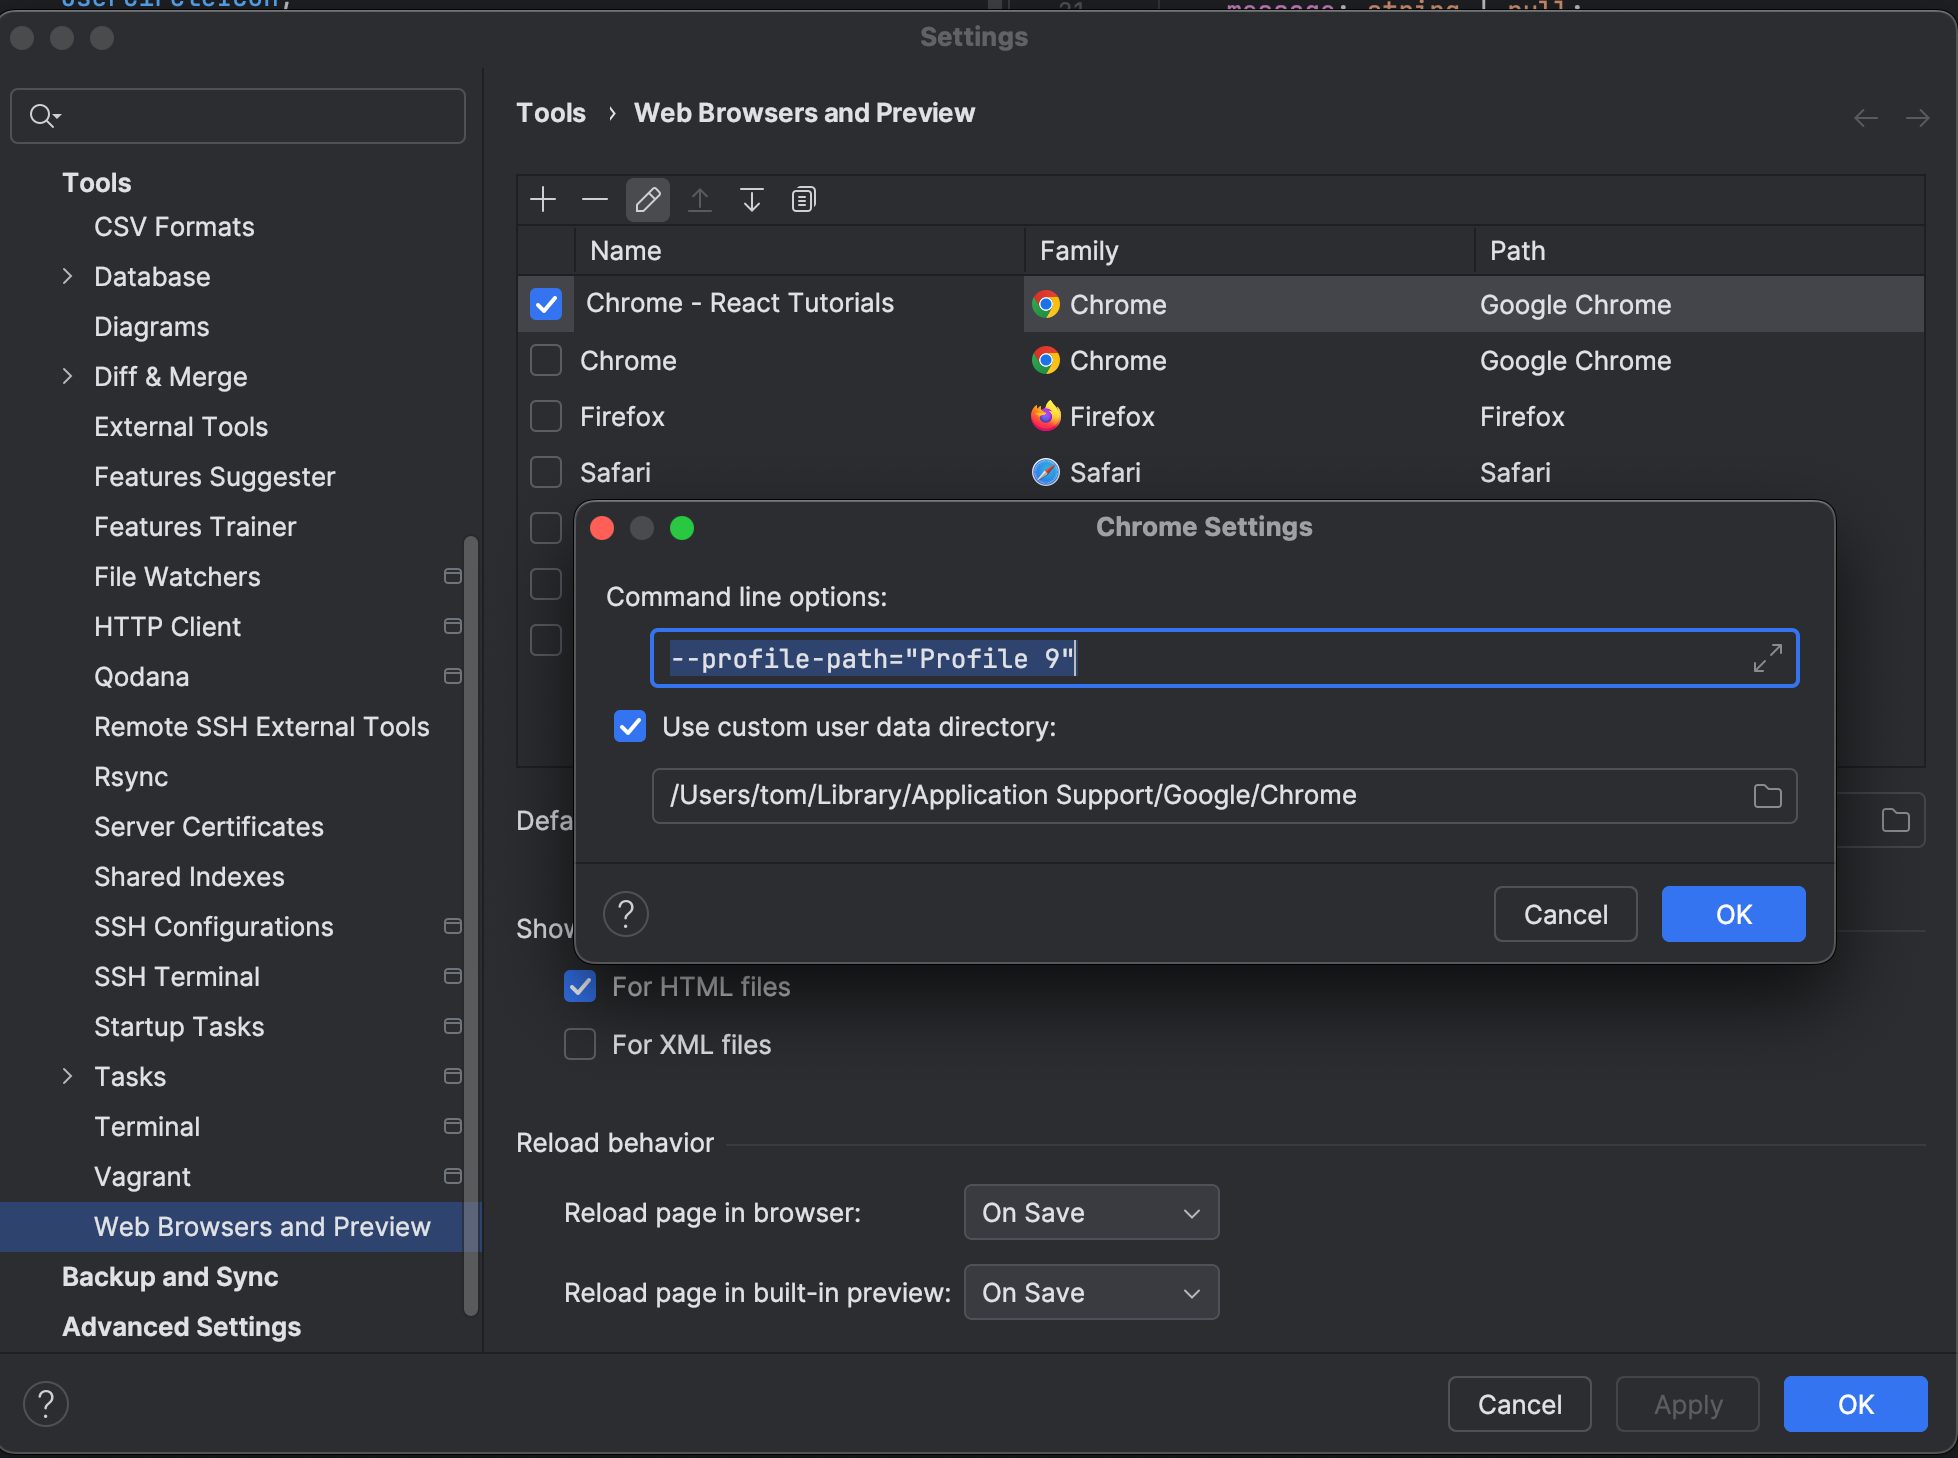
Googling may have landed you here after seeing other sites suggesting you use --profile-path="Profile 1" or similar. You’ll see how to use it below, but you’ll probably regret it.
If Chrome is already running from the same “User Data Directory”, it won’t be able to open the debug port! Consider instead just setting up WebSphere’s default profile to your liking rather than trying to commingle with your existing profiles.
Did you read the paragraph above? Ok, then continue.
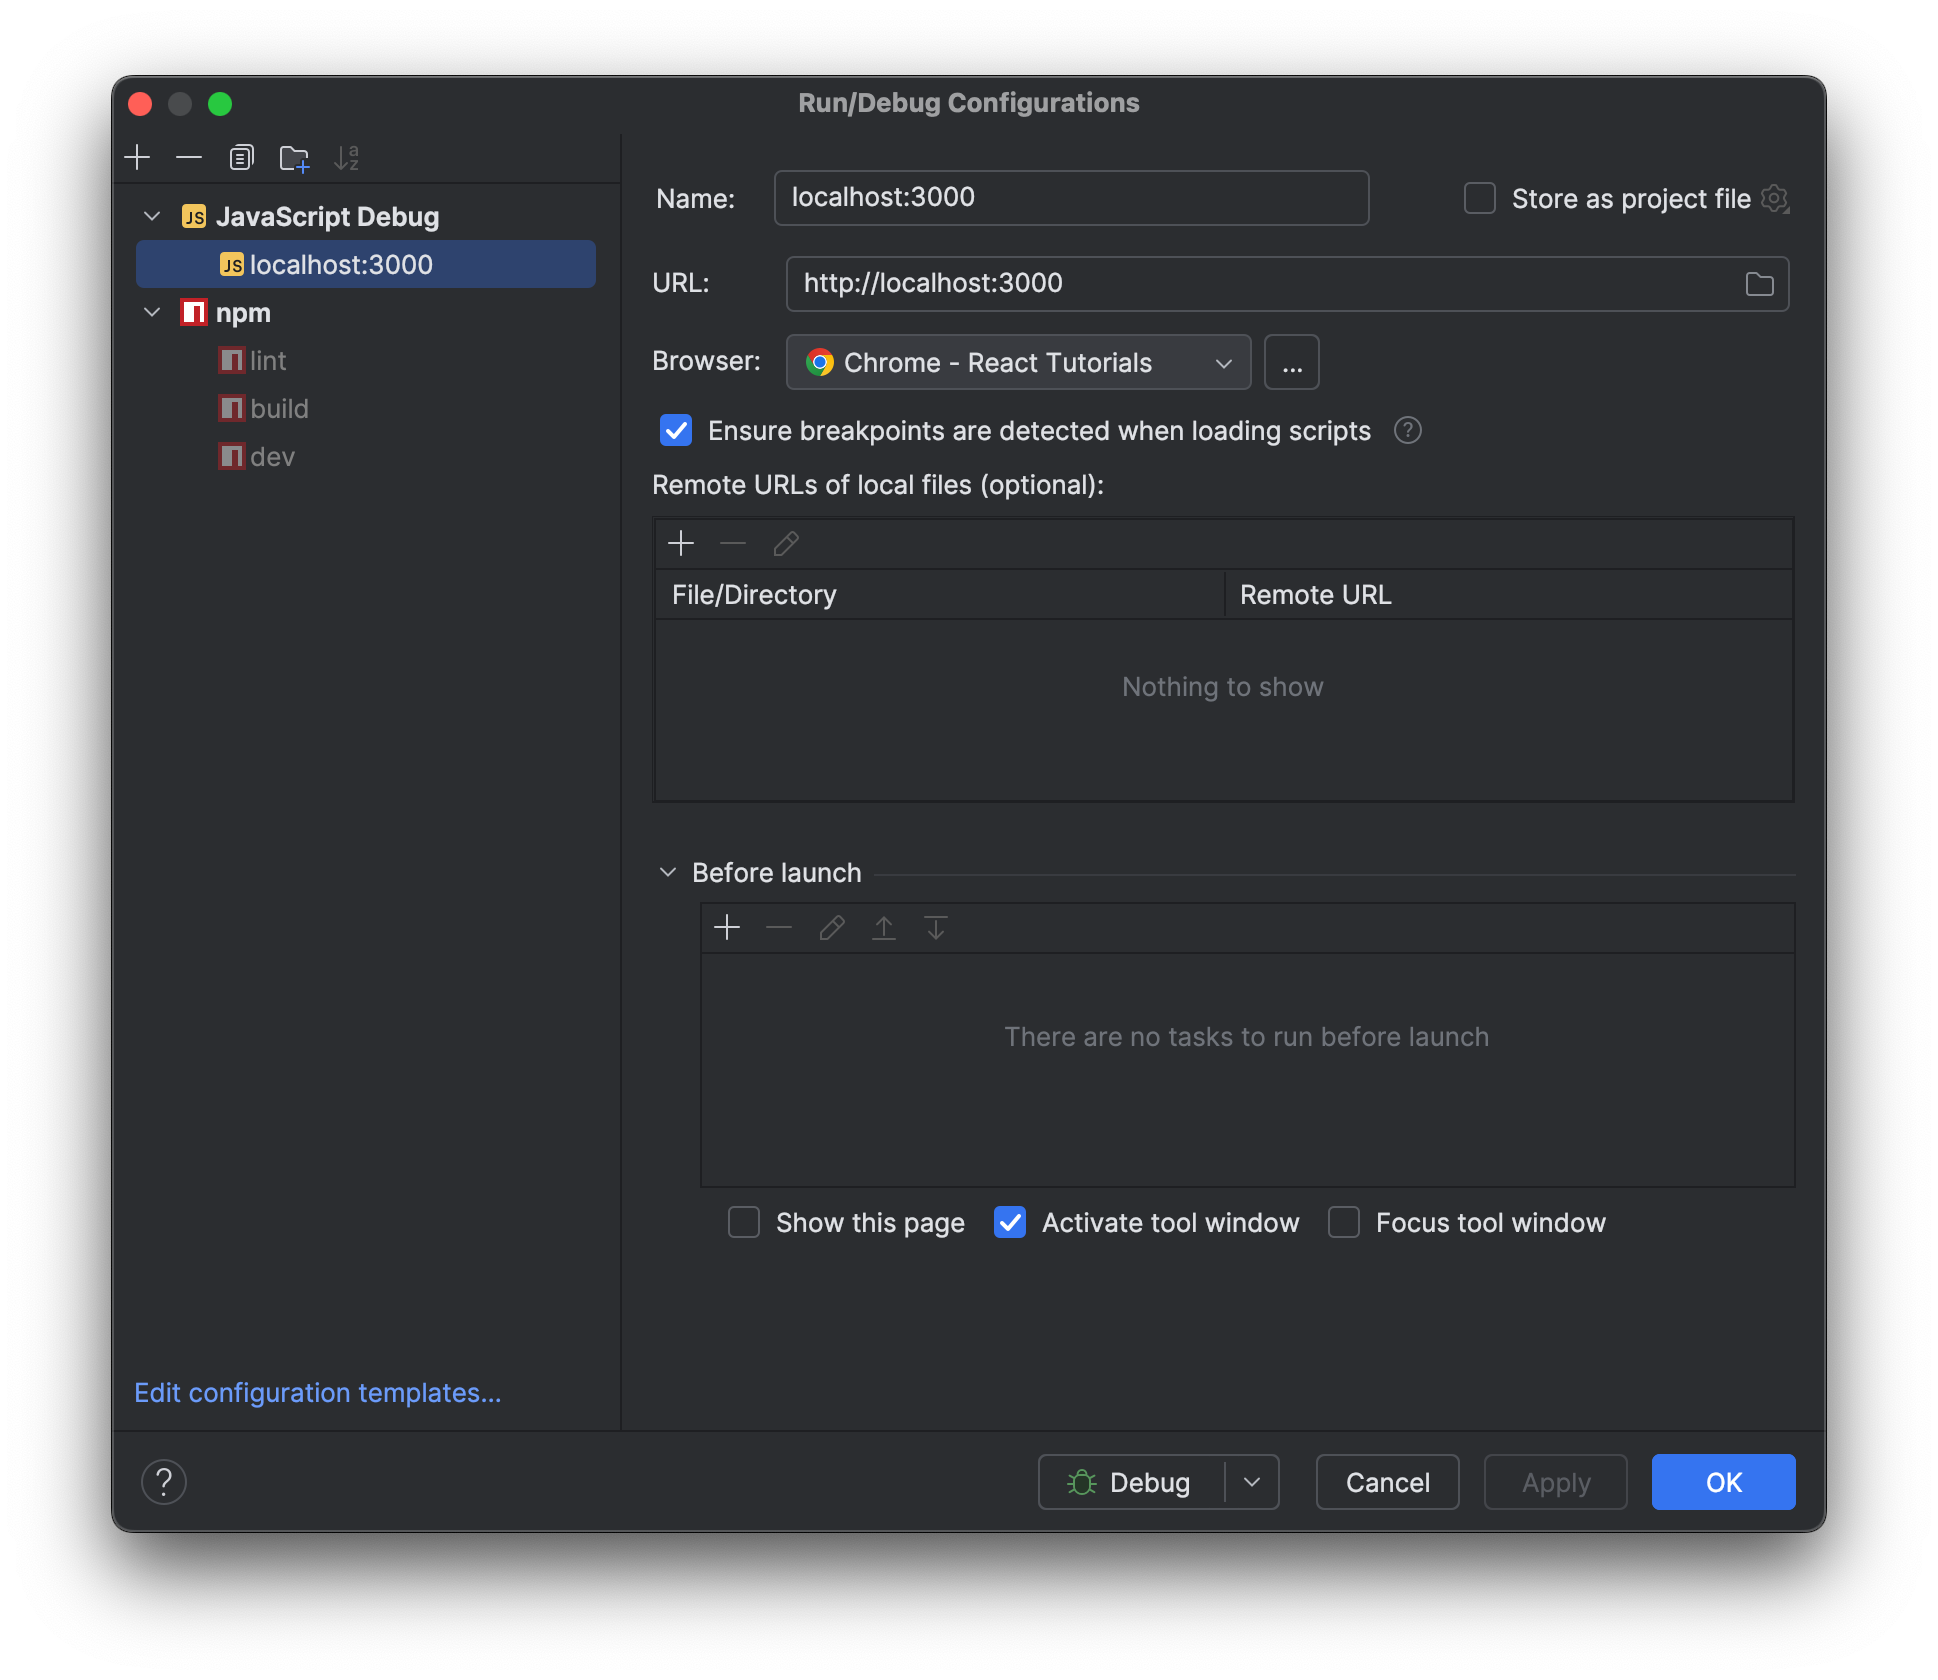
Go to Run > Edit Configurations and make a new JavaScript Debug Configuration using your Browser configuration from the last step.
If Chrome Was Already Running From that User Data Directory
#
Then you will get this error:
Waiting for connection to localhost:57739. Please ensure that the browser was started successfully with remote debugging port opened. Port cannot be opened if Chrome having the same User Data Directory is already launched.
And this, really, is why I gave up trying to re-use my very-special chrome profile and just created a new one in a separate user data directory.